Candlestick Patterns Every Trader Should Know
Candlestick charts are among the most widely used tools in modern financial markets. Whether trading stocks, forex, ETFs, commodities, futures, options, or cryptocurrencies, traders rely on candlestick patterns to analyze price action, identify market sentiment, and improve trading decisions.
Unlike basic line charts, candlestick charts provide detailed information about market behavior during a specific time period, including opening price, closing price, highest price, and lowest price. These visual representations help traders understand the ongoing battle between buyers and sellers.
In today's markets, candlestick analysis remains a core component of technical analysis despite the growth of algorithmic trading, artificial intelligence, quantitative models, and institutional trading systems. Many professional traders combine candlestick patterns with indicators such as RSI, MACD, moving averages, volume analysis, and support and resistance levels to develop high-probability trading setups.
This comprehensive guide explains the most important candlestick patterns every trader should know, how they work, when they are most effective, and how they can be integrated into a disciplined trading strategy.
What Is a Candlestick Chart?
A candlestick chart visually displays price movement during a specific period. Each candlestick contains four important data points:
- Opening Price
- Closing Price
- Highest Price
- Lowest Price
The body of the candle represents the difference between the opening and closing prices, while the shadows or wicks show the highest and lowest prices reached during the period.
| Component | Description |
|---|---|
| Open | Price at Start of Period |
| Close | Price at End of Period |
| High | Highest Price Reached |
| Low | Lowest Price Reached |
| Body | Difference Between Open and Close |
| Wick | Price Extremes Above and Below Body |
Why Candlestick Patterns Matter
Candlestick patterns help traders interpret market psychology.
They can reveal:
- Buyer strength
- Seller dominance
- Trend continuation
- Trend reversals
- Market indecision
- Potential breakout opportunities
While no pattern guarantees future results, candlestick analysis provides valuable context when combined with broader technical analysis techniques.
Categories of Candlestick Patterns
Candlestick formations generally fall into three major categories:
- Bullish Reversal Patterns
- Bearish Reversal Patterns
- Continuation Patterns
Understanding these categories helps traders evaluate market conditions more effectively.
Bullish Reversal Candlestick Patterns
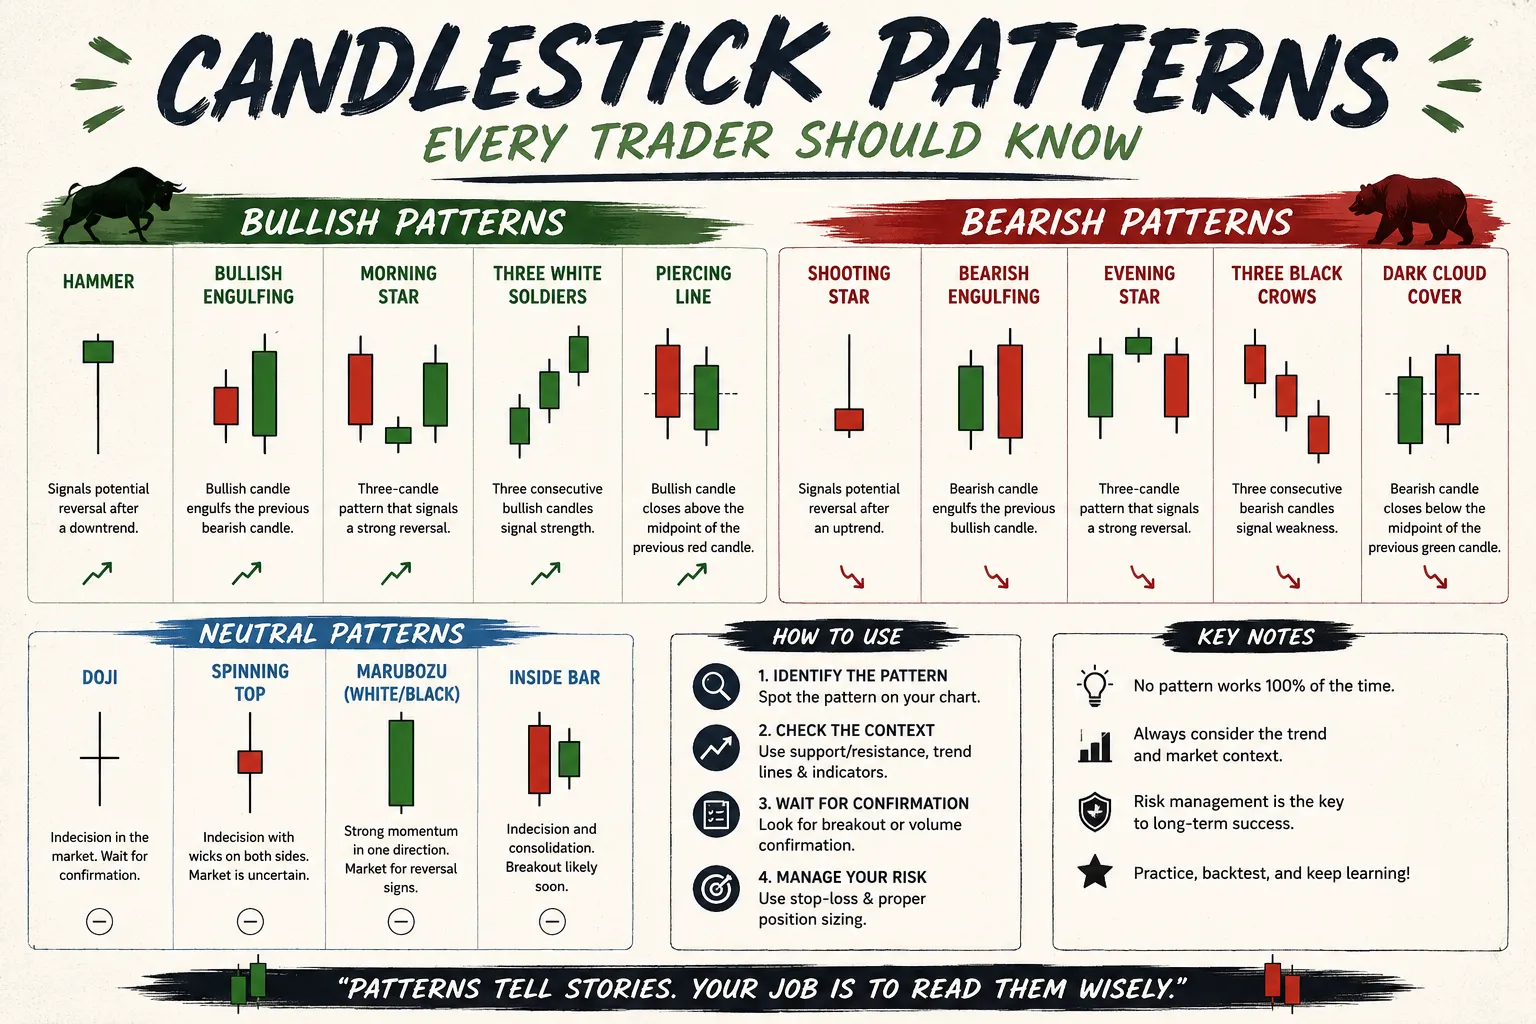
1. Hammer Pattern
The Hammer is one of the most recognized bullish reversal patterns.
Characteristics include:
- Small body near the top
- Long lower shadow
- Little or no upper shadow
- Appears after a decline
The pattern suggests that sellers pushed prices lower but buyers regained control before the session closed.
| Pattern | Signal | Reliability |
|---|---|---|
| Hammer | Bullish Reversal | Moderate to High |
2. Inverted Hammer
The Inverted Hammer appears after a downtrend and may indicate a potential bullish reversal.
Features:
- Small body
- Long upper shadow
- Minimal lower shadow
Confirmation from subsequent bullish price action is often recommended.
3. Bullish Engulfing Pattern
The Bullish Engulfing pattern consists of two candles.
Requirements:
- First candle is bearish
- Second candle completely engulfs previous body
- Appears after a decline
This pattern often signals strong buyer momentum entering the market.
4. Morning Star
The Morning Star is a three-candle reversal pattern.
Structure:
- Large bearish candle
- Small indecisive candle
- Strong bullish candle
It frequently signals the end of a downtrend.
5. Piercing Pattern
The Piercing Pattern develops when a bullish candle closes above the midpoint of a previous bearish candle.
Many traders interpret this as an early reversal signal.
Bearish Reversal Candlestick Patterns
1. Shooting Star
The Shooting Star is a bearish reversal pattern that appears after an uptrend.
Characteristics include:
- Small body
- Long upper wick
- Minimal lower shadow
The pattern suggests buyers initially pushed prices higher, but sellers regained control.
2. Bearish Engulfing Pattern
This pattern occurs when a large bearish candle completely engulfs the previous bullish candle.
It often signals increasing selling pressure.
3. Evening Star
The Evening Star is the bearish counterpart to the Morning Star.
Structure includes:
- Strong bullish candle
- Small indecisive candle
- Large bearish candle
It frequently appears near market tops.
4. Dark Cloud Cover
This pattern forms when a bearish candle closes below the midpoint of a previous bullish candle.
Many traders view it as an early warning sign of potential weakness.
5. Hanging Man
The Hanging Man resembles the Hammer but appears after an uptrend.
Its appearance suggests weakening buyer momentum.
Indecision Candlestick Patterns
Doji Pattern
The Doji occurs when opening and closing prices are nearly identical.
It reflects market indecision and balance between buyers and sellers.
| Doji Type | Interpretation |
|---|---|
| Standard Doji | Indecision |
| Dragonfly Doji | Potential Bullish Reversal |
| Gravestone Doji | Potential Bearish Reversal |
| Long-Legged Doji | High Uncertainty |
Doji candles become more meaningful when they occur at key support or resistance levels.
Continuation Candlestick Patterns
Not all candlestick patterns indicate reversals.
Some suggest that the existing trend may continue.
Rising Three Methods
This bullish continuation pattern appears during strong uptrends.
It consists of:
- Large bullish candle
- Several small bearish candles
- Another strong bullish candle
Falling Three Methods
This bearish continuation pattern occurs during strong downtrends.
It indicates sellers remain in control despite temporary buying activity.
Candlestick Patterns and Volume Analysis
Volume often strengthens candlestick signals.
For example:
- High-volume bullish engulfing patterns can indicate strong institutional buying.
- Heavy volume during bearish reversals may confirm selling pressure.
- Breakouts supported by increasing volume tend to be more reliable.
Many professional traders analyze volume alongside candlestick formations.
Support and Resistance Confirmation
Candlestick patterns become significantly more powerful when they occur near important support and resistance levels.
| Location | Potential Impact |
|---|---|
| Major Support | Stronger Bullish Reversal Signals |
| Major Resistance | Stronger Bearish Reversal Signals |
| Trendline Support | Continuation Opportunities |
| Trendline Resistance | Potential Reversals |
Combining candlestick analysis with market structure improves trade quality.
Using RSI with Candlestick Patterns
The Relative Strength Index (RSI) can help validate candlestick signals.
| RSI Condition | Candlestick Interpretation |
|---|---|
| RSI Below 30 | Bullish Reversal Patterns Gain Strength |
| RSI Above 70 | Bearish Reversal Patterns Gain Strength |
| RSI Divergence | Potential Trend Reversal |
Using multiple forms of confirmation helps reduce false signals.
Combining Candlestick Patterns with Moving Averages
Moving averages help traders identify broader trends.
Examples include:
- 50-Day Moving Average
- 100-Day Moving Average
- 200-Day Moving Average
A bullish candlestick pattern forming above a major moving average often carries more significance than one appearing within a downtrend.
Candlestick Patterns in Different Markets
Stock Markets
Candlestick analysis is widely used by equity traders for swing trading, day trading, and long-term position management.
Forex Markets
Currency traders frequently rely on candlestick setups due to the highly liquid and technical nature of forex markets.
Cryptocurrency Markets
Digital asset traders extensively use candlestick analysis because cryptocurrencies often exhibit strong technical behavior and volatility.
Options Trading
Options traders often use candlestick patterns to improve trade timing and identify favorable risk-reward opportunities.
Common Mistakes When Using Candlestick Patterns
- Trading patterns without confirmation
- Ignoring broader market trends
- Overlooking volume analysis
- Failing to use stop-loss orders
- Relying on a single indicator
- Ignoring risk management principles
- Trading emotionally
Successful trading requires discipline, patience, and consistent execution.
Risk Management for Candlestick Traders
No candlestick pattern is accurate 100% of the time.
Professional traders manage risk using:
- Stop-loss orders
- Position sizing rules
- Risk-reward ratios
- Portfolio diversification
- Trade journaling
| Risk Tool | Purpose |
|---|---|
| Stop Loss | Limit Downside Risk |
| Position Sizing | Control Exposure |
| Risk-Reward Ratio | Improve Profitability |
| Trade Journal | Improve Decision-Making |
The Role of AI and Algorithmic Trading
Modern trading increasingly incorporates artificial intelligence and machine learning.
Many institutional trading systems automatically scan for:
- Candlestick formations
- Trend signals
- Volume anomalies
- Momentum indicators
- Breakout opportunities
However, understanding candlestick psychology remains valuable because market behavior continues to be driven by human emotions and decision-making.
Best Candlestick Patterns Ranked by Popularity
| Pattern | Type | Popularity |
|---|---|---|
| Bullish Engulfing | Reversal | Very High |
| Bearish Engulfing | Reversal | Very High |
| Hammer | Reversal | High |
| Shooting Star | Reversal | High |
| Morning Star | Reversal | High |
| Evening Star | Reversal | High |
| Doji | Indecision | Very High |
| Rising Three Methods | Continuation | Moderate |
Final Thoughts
Candlestick patterns remain one of the most effective and accessible tools in technical analysis. They provide valuable insight into market psychology, buyer and seller behavior, trend reversals, and continuation opportunities.
While candlestick patterns alone should never form the basis of a complete trading strategy, they become significantly more powerful when combined with support and resistance analysis, volume confirmation, moving averages, RSI, MACD, and disciplined risk management practices.
Whether trading stocks, forex, options, ETFs, commodities, or cryptocurrencies, mastering key candlestick patterns can improve market awareness, enhance decision-making, and help traders develop a more structured and professional approach to navigating modern financial markets.